
Electricians average $71,490 a year in the United States, which is $34.37 an hour at 2,080 hours.
That national figure conceals a spread of nearly two to one across states.
| State | Annual mean | Per hour | |
|---|---|---|---|
| Highest | Oregon | $99,750 | $47.96 |
| Washington | $94,470 | $45.42 | |
| Hawaii | $92,870 | $44.65 | |
| Illinois | $92,230 | $44.34 | |
| Alaska | $90,040 | $43.29 | |
| US mean | $71,490 | $34.37 | |
| Florida | $57,660 | $27.72 | |
| Alabama | $57,510 | $27.65 | |
| North Carolina | $56,850 | $27.33 | |
| Lowest | Arkansas | $53,470 | $25.71 |
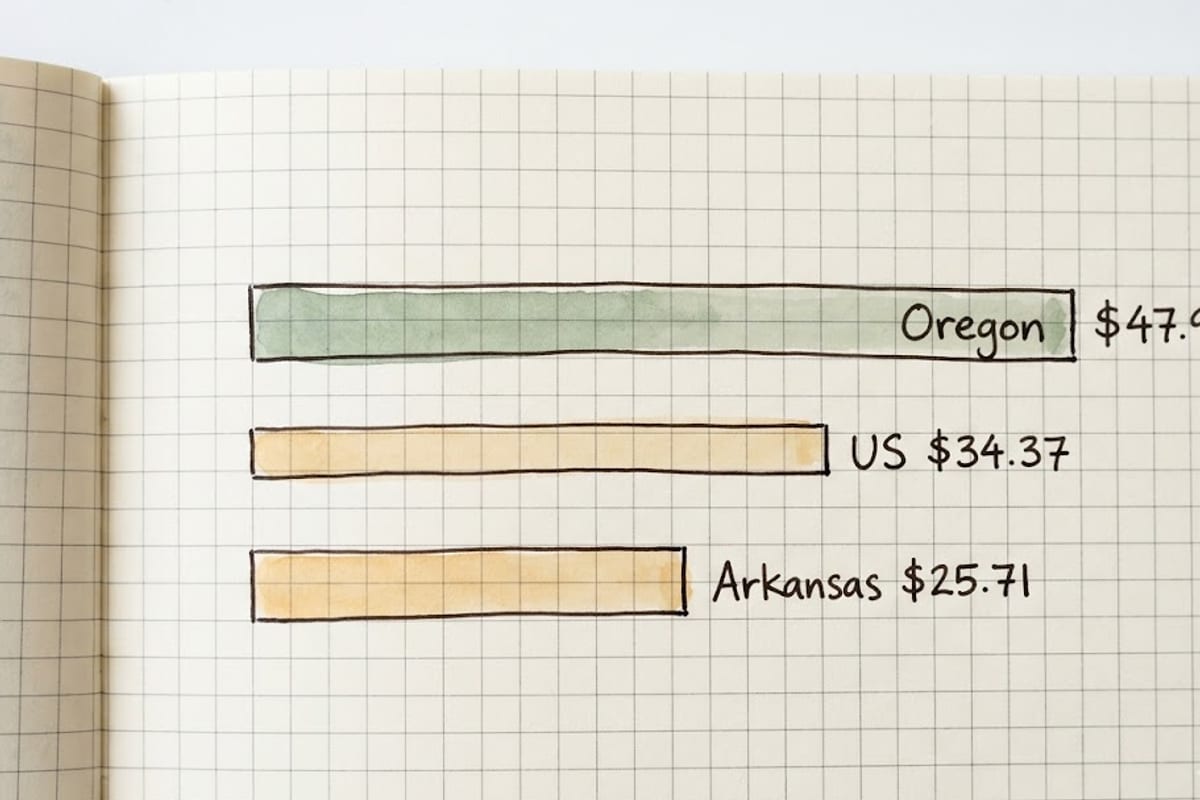
Oregon pays 86% more than Arkansas for the same licensed trade. That gap is larger than the gap between an apprentice and a journeyman in most states.
What drives the state spread
Three things, roughly in order of weight.
Union density. The highest-paying states — Oregon, Washington, Illinois, Alaska — have strong IBEW presence and prevailing-wage rules on public work. Union journeyman scale sets a floor that pulls the average up, including for non-union shops competing for the same labour.
Licensing structure. States with a formal apprenticeship-to-journeyman-to-master ladder and strict hour requirements have a smaller supply of licensed electricians per capita.
Construction demand and cost of living. These move together and are the weakest of the three, which is why the ranking is not simply a list of expensive states. Hawaii is expensive; Illinois is not, and both are near the top.
The hourly figure on a job advert is not the trade's rate
Three reasons the advertised number reads low against the table above:
Apprentices are paid a percentage of journeyman scale, typically starting at 40–50% and stepping up each year of the programme. A first-year apprentice advertised at $18 an hour is on the ladder, not on the rate.
Overtime is a real part of the income. Construction electricians commonly work more than 2,080 hours. Annual mean wage from BLS reflects actual earnings, so a $34.37 hourly conversion of the annual figure can sit above the base rate.
Benefits do not appear in either number. Union packages commonly add 25–35% in pension, health and training funds on top of the wage. Comparing a union wage with a non-union wage without the package attached compares two different things.

The ladder
| Stage | Typical duration | Pay |
|---|---|---|
| Apprentice, year 1 | 1 yr | 40–50% of journeyman |
| Apprentice, years 2–4 | 3 yr | 55–85%, stepping |
| Journeyman | — | The rates in the table |
| Master | 2+ yr after journeyman | 10–25% above journeyman |
| Contractor / owner | — | Business income, not wages |
The apprenticeship is paid throughout — four to five years of earning while training, ending with a licence and no student debt, which is the substance of the trades argument rather than the headline rate.
Where the numbers come from
Every figure here is from the Bureau of Labor Statistics Occupational Employment and Wage Statistics programme, SOC code 47-2111, annual mean wage. It is a survey of employers, published annually, and it excludes the self-employed — which means it understates income for owner-operators and small contractors.
Hourly conversions use 2,080 hours, the standard 40-hour year. That is a convention, not a measurement, and it is worth knowing exactly what it hides.
A high state number is not automatically a better job: the same wage buys very different amounts in different metros, and the same pattern repeats across every trade.