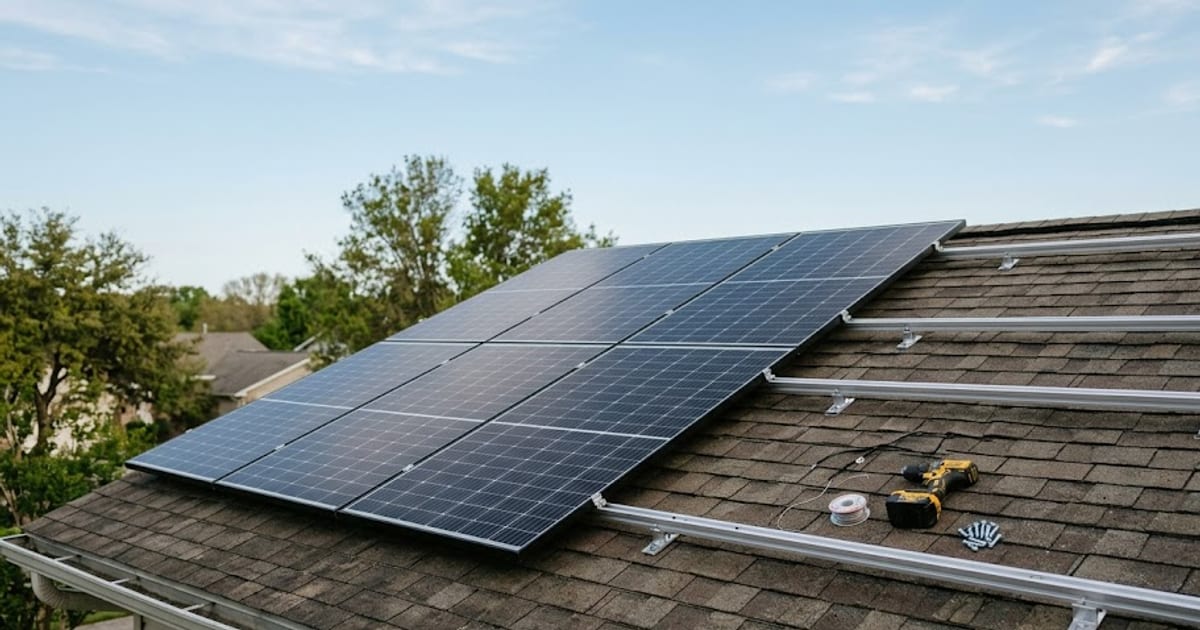
Solar photovoltaic installers average $57,900 a year nationally — $27.84 an hour at 2,080 hours. Ninth of the twelve construction trades tracked here.
| State | Annual | Hourly | |
|---|---|---|---|
| Highest | New Jersey | $78,690 | $37.83 |
| Hawaii | $73,000 | $35.10 | |
| Oregon | $71,390 | $34.32 | |
| Nevada | $70,830 | $34.05 | |
| US mean | $57,900 | $27.84 | |
| Indiana | $49,310 | $23.71 | |
| Arkansas | $48,710 | $23.42 | |
| Lowest | North Carolina | $47,420 | $22.80 |
Only 32 states have a published figure
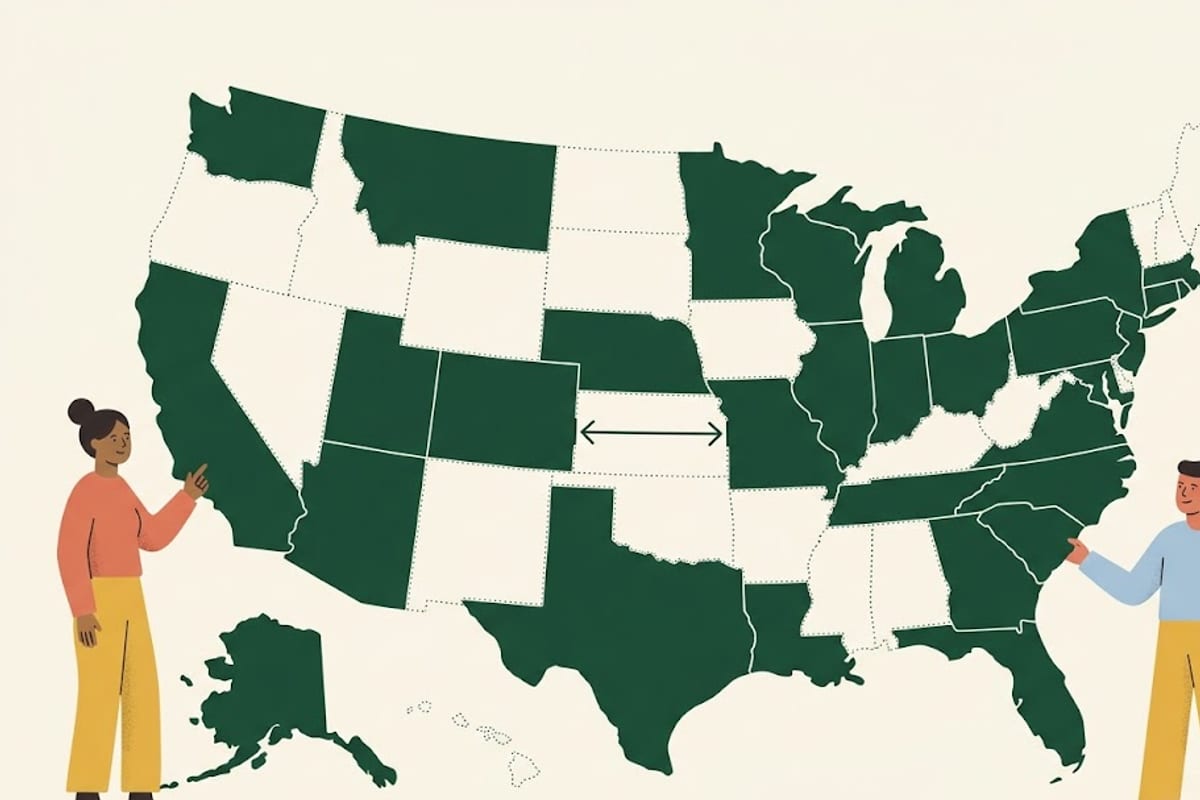
This is the only trade on the site where BLS suppresses the number in a large share of states — 19 of 51 have no published mean.
Suppression happens when the survey sample is too small to publish without effectively identifying individual employers. In practical terms it means the trade barely exists as a distinct occupation in those states: installers are counted as electricians or general construction workers instead.
That has two consequences worth holding onto. The national mean is built from a narrower base than the other trades here, and it skews toward states with established solar markets. And a state with no figure is not a state with no solar work — it is a state where the work is done by people classified under another code.
Rooftop and utility-scale are different jobs
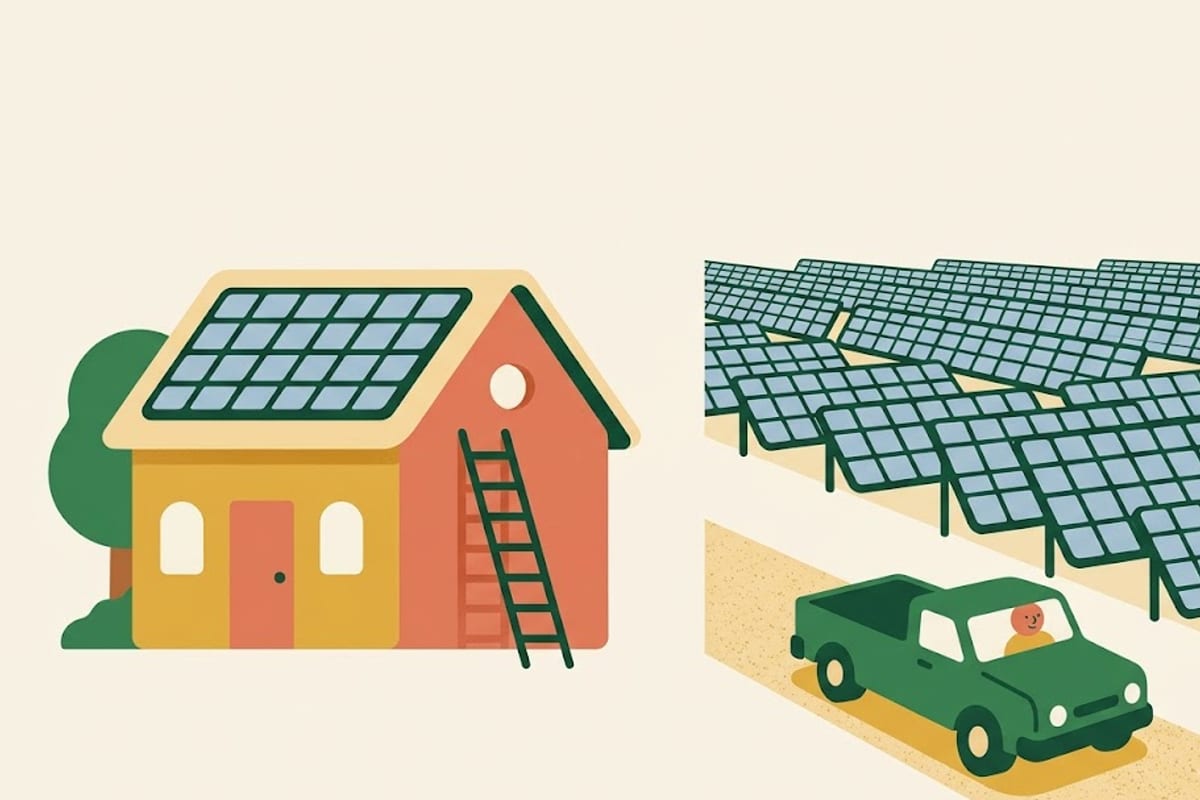
Residential rooftop is the visible half of the industry: two to four panel arrays, roof penetrations, inverters, and a great deal of time on ladders and roofs. It pays at the lower end, turnover is high, and much of the workforce is young.
Commercial and utility-scale field work is closer to heavy construction — racking, trenching, high-voltage terminations, and long hours on remote sites. It pays clearly better, often runs on per-diem, and has more in common with the electrical trade than with roofing.
BLS reports both under one code, so the mean sits between two populations rather than describing either.
Where the licensing sits
There is no national solar installer licence. What exists instead:
NABCEP certification is the recognised industry credential and is voluntary in most states, though some incentive programmes require it.
Electrical licensing governs the parts that matter most. Making the final connections to a service panel is licensed electrical work almost everywhere, which is why solar crews are commonly a licensed electrician plus installers rather than a crew of equals — and why the electrician on the crew earns considerably more than the mean above.
That structure is the practical career path in the trade: installers who go on to complete an electrical apprenticeship move from $27 an hour to a licensed journeyman rate.
Why the state ranking looks the way it does
New Jersey, Hawaii, Oregon and Nevada lead. These are states with long-running incentive programmes and, in New Jersey's case, strong union presence in the electrical trade.
The bottom of the table is mostly the Southeast, where installed capacity has grown but wages have not followed — a large, young, non-union workforce and no licensing gate specific to the trade.
The figure that moves fastest
This is the newest occupation on the site and the one whose published mean changes most between annual releases, because the workforce is expanding and its composition keeps shifting.
That makes it the one figure here worth re-checking rather than assuming. It also means an old number found elsewhere online is more likely to be stale for this trade than for any other.
The full trade ranking puts it in context, and the electrician figures show where the licensed path leads.