Pay by Metro
The same job across metros, and what the gap is really made of.
The same trade, the same licence, the same work — and up to 86% difference in pay depending on which state it is done in.
That is the single most useful fact on this site, and it is not what most people expect. The states at the top of a trade wage table are not simply the expensive ones.
What actually drives the ranking
Union density and prevailing-wage law does most of the work. States with strong trade unions and legal wage floors on publicly funded projects pull the whole state average up, because private employers compete for the same labour. Oregon, Washington and Illinois sit at or near the top of most trade tables for this reason, and Illinois in particular is not an expensive state outside Chicago.
Licensing structure comes second. States with a formal apprenticeship ladder and strict hour requirements have fewer licensed workers per capita, and a tighter supply of licensed labour raises the price of it.
Cost of living and construction demand come third, and they are weaker than people assume. Colorado ranks in the bottom half for several trades despite Denver housing costs well above the national median. Texas ranks low across the board despite enormous construction volume.
The strongest single correlation visible in the data is with right-to-work status: most of the bottom quartile in most trades are right-to-work states.
Reading a state figure honestly
A state average blends very different metros. New York State combines New York City with rural counties. The spread inside a large state can be as wide as the spread between two states.
It also excludes the self-employed, so in states with many small residential contractors the published number describes employees rather than the trade.
A high number is not automatically a better job
Pay is half the question. What the money buys locally is the other half, and the two rankings do not match — which is what the cost-of-living pages here are for.
5 articles
Plumber salary in Missouri
| Annual meanBLS OEWS, SOC 47-2152 | $75,010 |
|---|---|
| Hourly equivalentannual ÷ 2080 hours | $36.06 |
| US mean for this trade$34.70/hour | $72,170 |
| Against the national meanMissouri pays above average for this trade | +3.9% |
| Rank among states | 19 of 51 |
| Highest-paying state | Oregon — $98,450 |
| Lowest-paying state | Arkansas — $50,640 |
Notes
- Plumber. Licensed trade with a formal apprenticeship, and the licence is what sets the floor. Service plumbing on call pays overtime premiums that do not appear in a base rate, and the step from journeyman to master licence is the largest single jump in the trade.
- Missouri sits above the national mean by 3.9%, ranking 19 of 51. The spread across states for this trade runs from $50,640 to $98,450 — a factor of 1.94. That gap is wider than the step between apprentice and journeyman in most states, and it is driven more by union density and prevailing-wage law than by cost of living.
- This is an annual mean, not a median, so a small number of high earners pulls it upward — particularly in states with large industrial or utility employers. It also excludes the self-employed, which understates income in a trade where many experienced workers run their own operation.
- The hourly figure divides by 2,080 hours, the standard 40-hour year. Construction trades commonly work more than that, and overtime is already inside the annual figure, so the true base rate is usually a little lower than the conversion suggests.
Pay by trade and state
612 calculations · browse all
- Roofer salary in Alabama
- Roofer salary in Idaho
- Roofer salary in Missouri
- Roofer salary in Pennsylvania
- Painter salary in Alabama
- Painter salary in Idaho
- Painter salary in Missouri
- Painter salary in Pennsylvania
- Carpenter salary in Alabama
- Carpenter salary in Idaho
- Carpenter salary in Missouri
- Carpenter salary in Pennsylvania
- Drywall Installer salary in Alabama
- Drywall Installer salary in Idaho
- Drywall Installer salary in Missouri
- Drywall Installer salary in Pennsylvania
- Insulation Worker salary in Alabama
- Insulation Worker salary in Idaho
- Insulation Worker salary in Missouri
- Insulation Worker salary in Pennsylvania
- Plumber salary in Alabama
- Plumber salary in Idaho
- Plumber salary in Missouri
- Plumber salary in Pennsylvania
- Electrician salary in Alabama
- Electrician salary in Idaho
- Electrician salary in Missouri
- Electrician salary in Pennsylvania
- HVAC Technician salary in Alabama
- HVAC Technician salary in Idaho
- HVAC Technician salary in Missouri
- HVAC Technician salary in Pennsylvania
- Septic Tank Servicer salary in Alabama
- Septic Tank Servicer salary in Idaho
- Septic Tank Servicer salary in Missouri
- Septic Tank Servicer salary in Pennsylvania
- Concrete Finisher salary in Alabama
- Concrete Finisher salary in Idaho
- Concrete Finisher salary in Missouri
- Concrete Finisher salary in Pennsylvania
- Solar Installer salary in Alabama
- Solar Installer salary in Idaho
- Solar Installer salary in Missouri
- Solar Installer salary in Pennsylvania
- Glazier salary in Alabama
- Glazier salary in Idaho
- Glazier salary in Missouri
- Glazier salary in Pennsylvania
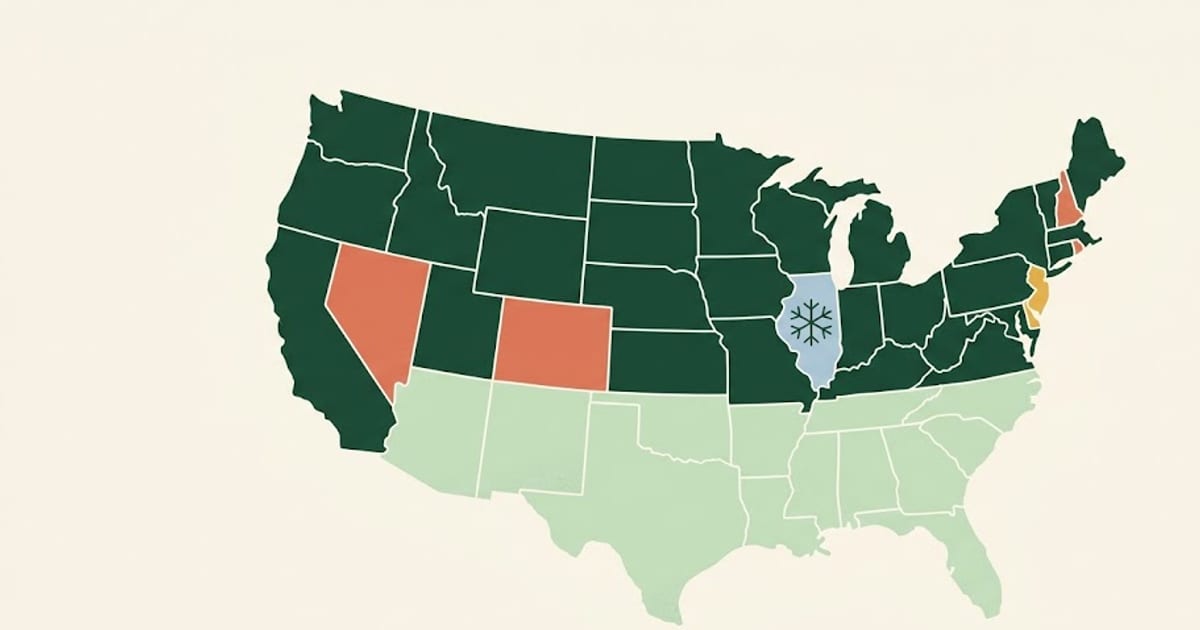 Roofer Pay by State — Illinois $77,650, Arkansas $45,780
Roofing pays best where the season is shortest. That sounds backwards until you look at what a short season does to the labour supply.
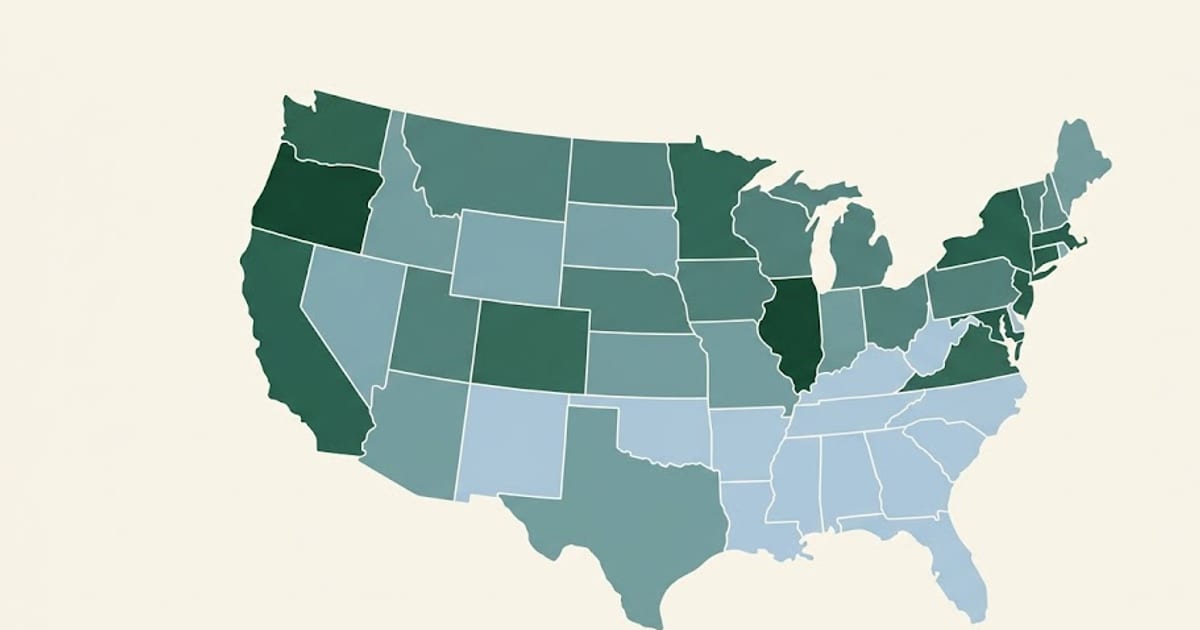 Plumber Salary by State: $98,450 in Oregon to $50,640 in Arkansas
Oregon pays a plumber 94% more than Arkansas for the same licence. The states at the top are not the expensive ones — they are the union ones.
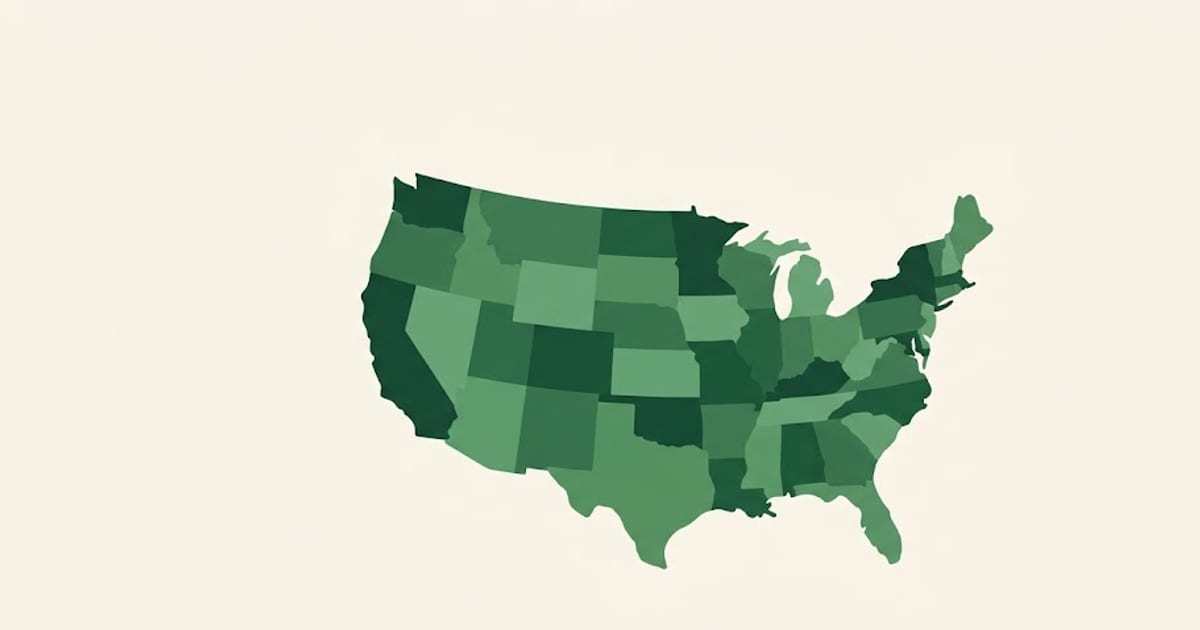 HVAC Technician Salary by State: $84,920 in DC to $51,150 in Arkansas
The narrowest spread of any trade here — 1.66 times from top to bottom. Service and replacement demand exists wherever buildings do, and that puts a floor under the low-wage states.
 Why Union Electricians Earn More: Scale, Prevailing Wage, and the Package
Union density explains the state wage rankings better than cost of living does. The hourly difference is the smaller half — the package is the larger one.
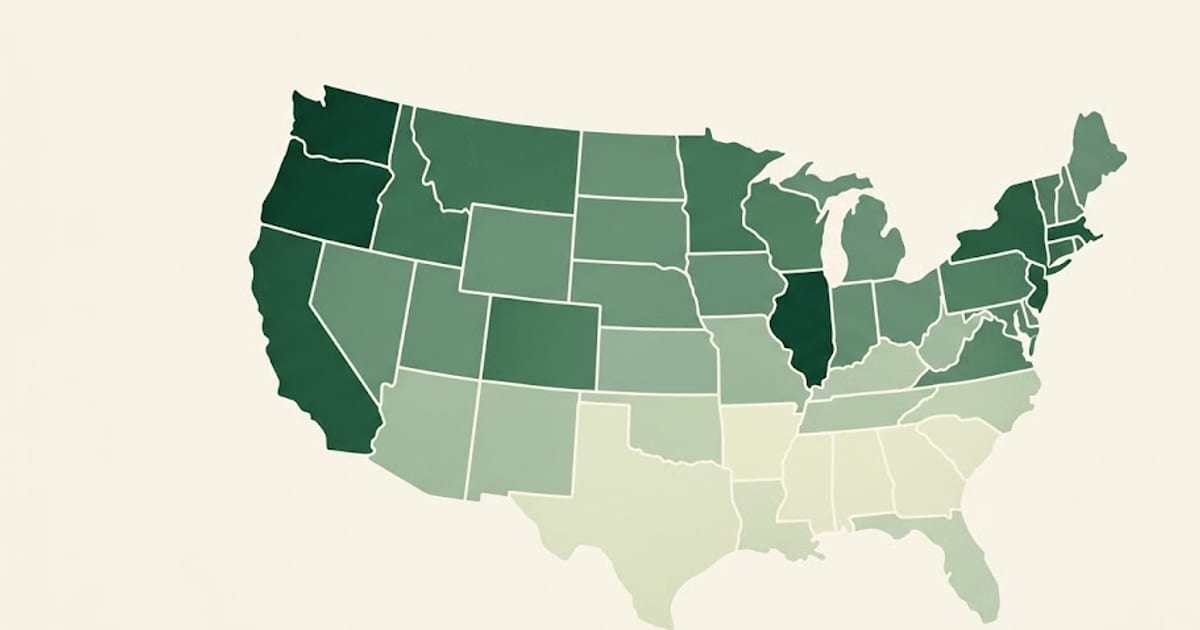 Electrician Salary by State: All 51, From $99,750 to $53,470
Two states pay the same trade $46,000 apart. The list below is sorted by that number, and the order is not the order of living costs.