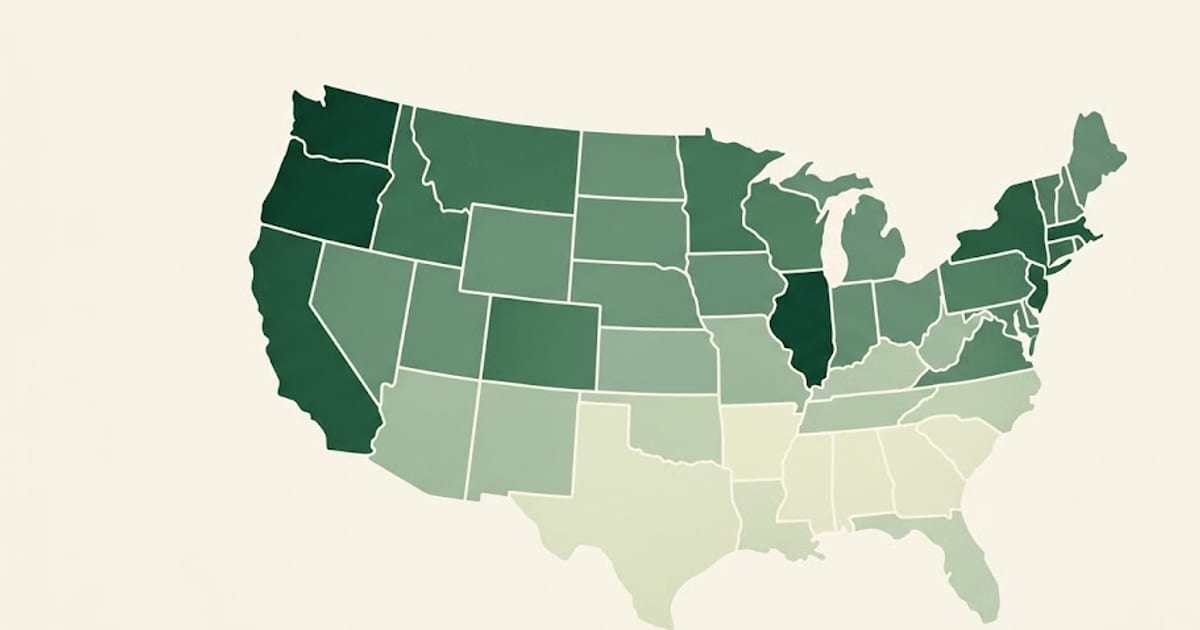
Annual mean wage for electricians, SOC 47-2111, all fifty states and the District of Columbia. Hourly figures are the annual divided by 2,080.
| State | Annual | Hourly |
|---|---|---|
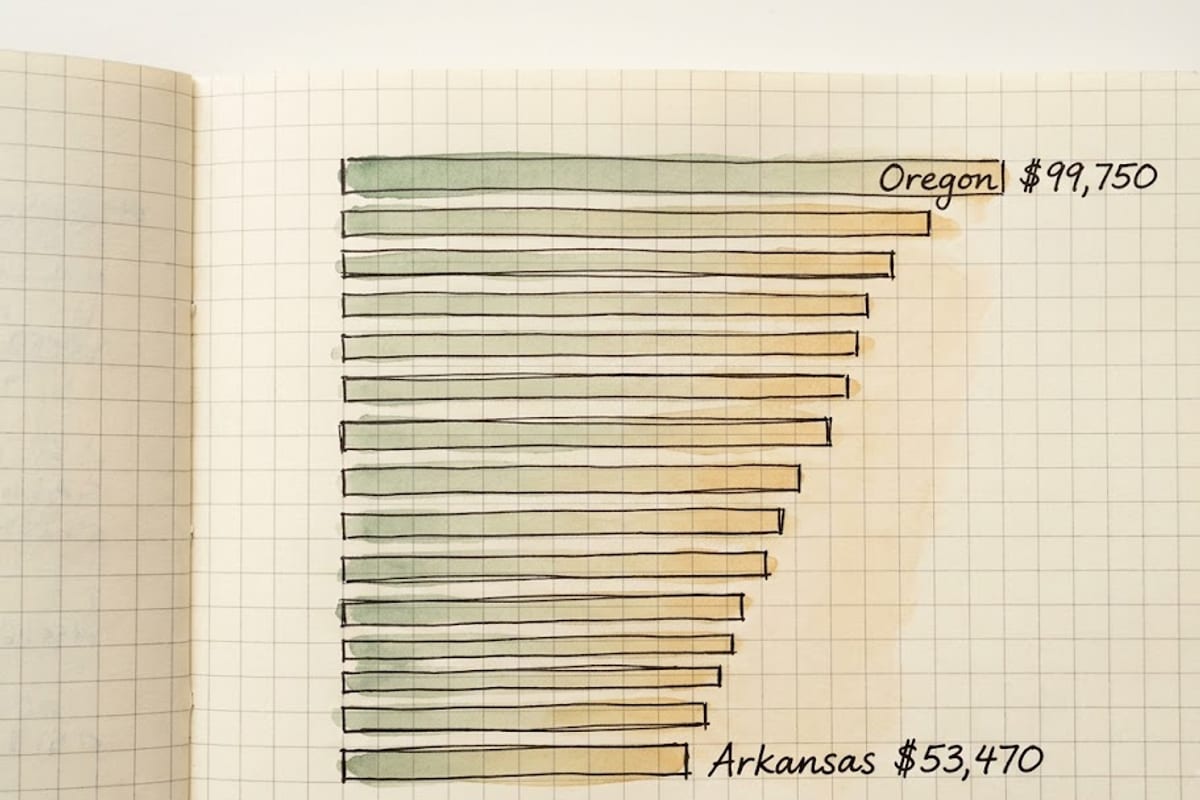
| Oregon | $99,750 | $47.96 |
| Washington | $94,470 | $45.42 |
| Hawaii | $92,870 | $44.65 |
| Illinois | $92,230 | $44.34 |
| Alaska | $90,040 | $43.29 |
| District of Columbia | $88,860 | $42.72 |
| New Jersey | $86,700 | $41.68 |
| California | $85,860 | $41.28 |
| New York | $84,860 | $40.80 |
| Massachusetts | $81,560 | $39.21 |
| Minnesota | $80,830 | $38.86 |
| Connecticut | $77,390 | $37.21 |
| Maine | $77,250 | $37.14 |
| Pennsylvania | $75,770 | $36.43 |
| Nevada | $75,710 | $36.40 |
| Maryland | $75,450 | $36.27 |
| Wyoming | $74,860 | $35.99 |
| Rhode Island | $74,150 | $35.65 |
| Michigan | $73,840 | $35.50 |
| Wisconsin | $73,810 | $35.49 |
| Vermont | $73,360 | $35.27 |
| Missouri | $72,310 | $34.76 |
| Montana | $71,930 | $34.58 |
| United States | $71,490 | $34.37 |
| Indiana | $70,820 | $34.05 |
| Delaware | $70,750 | $34.01 |
| North Dakota | $70,460 | $33.88 |
| Kansas | $69,200 | $33.27 |
| Ohio | $68,840 | $33.10 |
| Virginia | $67,850 | $32.62 |
| West Virginia | $67,840 | $32.62 |
| Idaho | $66,600 | $32.02 |
| Colorado | $66,310 | $31.88 |
| New Hampshire | $65,780 | $31.63 |
| Utah | $65,290 | $31.39 |
| Arizona | $64,220 | $30.88 |
| Nebraska | $63,960 | $30.75 |
| Tennessee | $63,540 | $30.55 |
| Oklahoma | $63,410 | $30.49 |
| Iowa | $63,190 | $30.38 |
| Louisiana | $62,350 | $29.98 |
| South Dakota | $61,980 | $29.80 |
| Kentucky | $61,410 | $29.52 |
| Georgia | $61,090 | $29.37 |
| New Mexico | $59,620 | $28.66 |
| Texas | $59,280 | $28.50 |
| South Carolina | $59,030 | $28.38 |
| Mississippi | $58,000 | $27.88 |
| Florida | $57,660 | $27.72 |
| Alabama | $57,510 | $27.65 |
| North Carolina | $56,850 | $27.33 |
| Arkansas | $53,470 | $25.71 |
The ranking is not a cost-of-living ranking
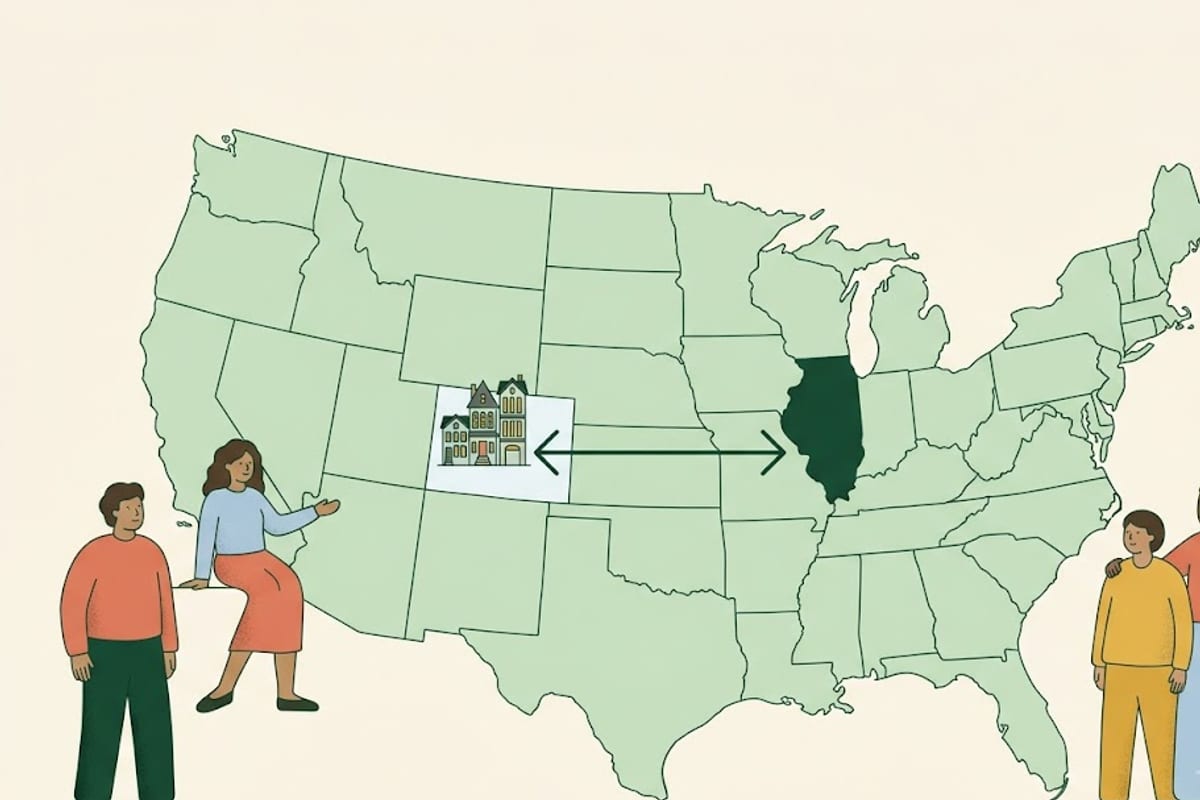
If pay simply tracked living costs, the list would open with Hawaii, California, New York and Massachusetts. It opens with Oregon and Washington, and Illinois sits fourth despite unremarkable costs outside Chicago.
Meanwhile Colorado ranks 33rd at $66,310 despite Denver housing costs well above the national median, and Texas ranks 46th in a state with enormous construction volume.
Three things explain most of the order:
Union density and prevailing wage law. The top of the list is largely IBEW territory with prevailing-wage requirements on public projects. Illinois and Oregon are the clearest cases: strong union scale, and a legal floor on publicly funded work that private employers must compete against.
Licensing barriers. States with strict hour requirements and state-level licensing restrict supply. States where licensing is municipal or minimal have a wider labour pool.
Right-to-work status. Most of the bottom quartile — Arkansas, North Carolina, Alabama, Mississippi, South Carolina, Texas — are right-to-work states. This is the strongest single correlation visible in the table.
Reading a state number correctly
It is a mean, not a median. A small number of very high earners pulls the mean above what a typical electrician makes, particularly in states with large industrial or utility employers.
It excludes the self-employed. BLS OEWS surveys employers, so owner-operators and one-person contractors are absent. In states with many small residential contractors, the published figure describes employees rather than the trade.
It is a state average across very different metros. New York State combines New York City with rural counties. State-level data smooths a spread that can be as wide within a state as between two states.
The pay figure alone answers only half the question — what the money buys locally is the other half, and the hourly conversion carries assumptions worth checking.
Source: U.S. Bureau of Labor Statistics, Occupational Employment and Wage Statistics, SOC 47-2111, annual mean wage. Self-employed workers excluded.