
The Bureau of Labor Statistics puts the national annual mean wage for carpenters (SOC 47-2031) at $65,630. That figure covers everyone in the occupation, from a first-year apprentice to a commercial foreman.
The number that actually predicts a paycheque is the state.
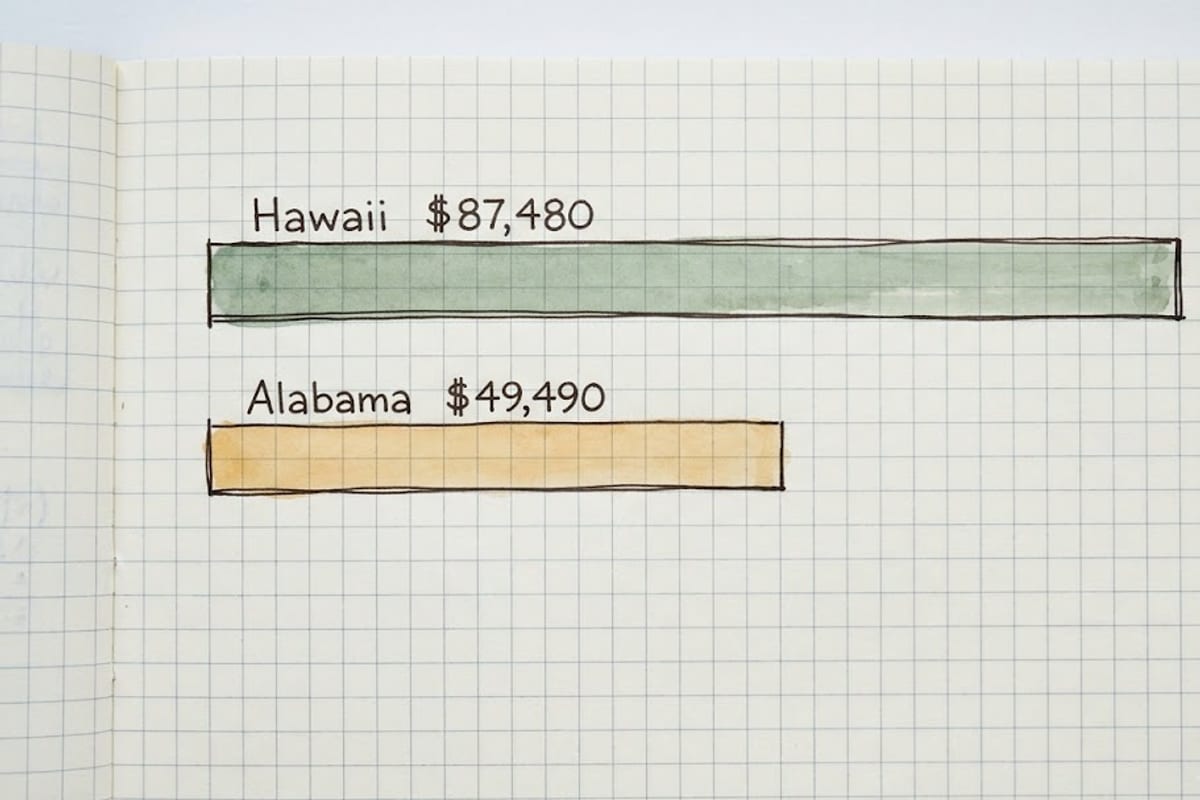
The geographic spread
| State | Annual mean |
|---|---|
| Hawaii | $87,480 |
| Alaska | $80,460 |
| Illinois | $80,320 |
| California | $78,810 |
| National | $65,630 |
| Arkansas | $51,350 |
| Georgia | $50,290 |
| Alabama | $49,490 |
Top to bottom is a $38,000 gap on the same job title, and it is far larger than the difference between a third-year and a tenth-year carpenter within one market.
Why the gap is bigger than cost of living explains
Hawaii and Alaska are expensive places to live, and part of the premium is that. Illinois is not especially expensive outside Chicago, and it still sits near the top.
The variable that tracks best is union density. States with strong commercial carpentry union presence — Illinois, New York, New Jersey, Washington, Minnesota — cluster at the high end regardless of cost of living. Union scale sets a floor that pulls non-union rates up with it, because contractors compete for the same labour pool.
The second variable is what is being built. A state whose construction is mostly residential tract housing pays differently from one with large commercial and industrial projects, and the SOC code covers both.
What "carpenter" includes
The occupation is broad, and the pay within it is not uniform:
Rough framing — fast, physical, weather-exposed, and typically at the lower end of the range.
Finish carpentry — trim, stairs, built-ins. Slower, more skill-dependent, and paid accordingly.
Commercial and industrial — metal stud framing, formwork, interior fit-out. Usually the best-paid, usually union, usually the most consistent hours.
Cabinetmaking and millwork is a separate SOC code and is not in this figure at all.
What moves an individual's number
Union membership, which is the single largest factor in most markets.
Licensing and certification where the state requires it, plus specialised credentials — scaffold, welding, forklift, OSHA 30.
Overtime. Construction wages are hourly, so a year with substantial overtime and a year without look very different at the same rate. The BLS mean is annual and absorbs this, which is one reason a good year can exceed the state mean substantially.
Running your own crew, which moves the question from wages to business income and out of this data entirely.
Reading the number honestly
A mean is pulled upward by high earners. The median is lower than the mean in most construction occupations, so the typical carpenter earns somewhat less than $65,630 while the average is exactly that.
The figures also lag: BLS publishes annually and the data behind a release is gathered over the preceding period, so in a market moving quickly the real rate today is ahead of the published one.
Use the state figure as a floor for negotiation and the national figure for nothing at all.
Apprentice to journeyman
Formal apprenticeships in carpentry typically run three to four years and pay on a published scale — commonly starting around 50% of journeyman rate and stepping up every six months or thousand hours until it reaches full scale on completion.
That structure is why the occupation's earnings distribution is wide. A first-year apprentice and a journeyman foreman on the same site are both counted as carpenters in the BLS figure, and they are earning very different money.
For anyone comparing an offer against the state mean, the relevant question is where in that progression the offer sits. A journeyman rate at 90% of the state mean is a poor offer; an apprentice rate at 60% is a normal one.
What the figure leaves out
Benefits. Union packages include health coverage and a pension contribution paid on top of the hourly rate, and neither appears in the wage figure. In markets with strong union presence the total package can exceed the published wage substantially, which widens the real gap between union and non-union beyond what the table shows.
Travel and per diem on commercial work, which is not wages but is money.
Tool allowances, and on the other side, the cost of tools where there is no allowance — a finish carpenter's kit is a real annual expense that a labourer's is not.
Hourly against annual
BLS publishes an annual mean, and construction is paid hourly. Dividing by 2,080 hours gives a nominal hourly figure, but that division assumes a full year of full weeks — which framing carpenters in northern markets do not get.
The practical consequence is that the underlying hourly rate in a short-season state is higher than the annual figure implies, because the annual figure is spreading the same wage over fewer worked hours. Comparing hourly offers across states using annual means understates the northern rates.
Going the other way, in a market with year-round work and consistent overtime, an annual figure can overstate the base rate. A carpenter at a modest hourly rate working fifty-hour weeks all year lands above the state mean without the rate being good.
Ask for the hourly rate, the typical week, and whether overtime is available. Those three numbers describe a job; an annual figure describes a statistic.
Where the work is going
Two shifts are visible in the occupation and both affect pay.
Prefabrication. Wall panels, floor cassettes and roof trusses arriving finished move hours out of the field and into a plant, where the work is classified differently and paid differently. This has been reducing rough framing hours per house steadily for years.
Fit-out and renovation. As new construction cools, commercial interior work and residential renovation absorb crews, and both favour finish skills over framing speed. Carpenters whose experience is entirely rough framing find that transition harder than the job title suggests.
Neither changes the state figures much in a single year. Both change what kind of carpentry is worth learning over a career.