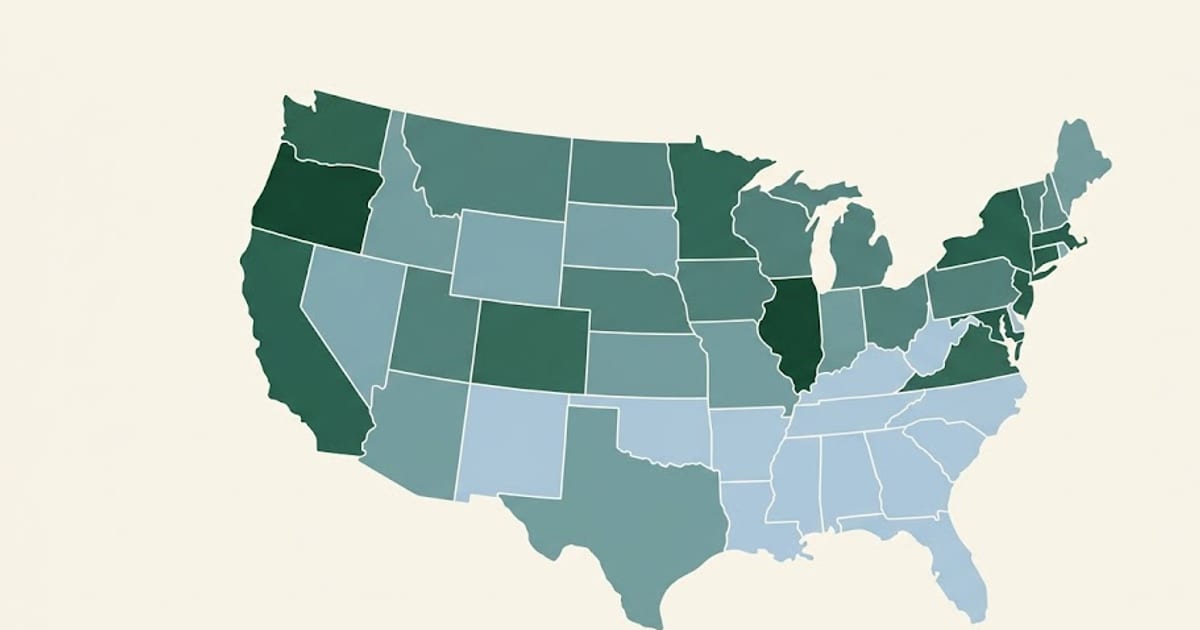
Annual mean wage for plumbers, pipefitters and steamfitters, SOC 47-2152. Hourly is the annual divided by 2,080.
| State | Annual | Hourly | |
|---|---|---|---|
| 1 | Oregon | $98,450 | $47.33 |
| 2 | Illinois | $93,400 | $44.90 |
| 3 | New Jersey | $92,590 | $44.52 |
| 4 | District of Columbia | $91,200 | $43.85 |
| 5 | Alaska | $90,460 | $43.49 |
| 6 | Massachusetts | $90,410 | $43.47 |
| — | United States | $72,170 | $34.70 |
| 46 | North Carolina | $56,720 | $27.27 |
| 47 | Mississippi | $56,690 | $27.25 |
| 48 | Florida | $56,030 | $26.94 |
| 49 | South Carolina | $55,890 | $26.87 |
| 50 | South Dakota | $55,530 | $26.70 |
| 51 | Arkansas | $50,640 | $24.35 |
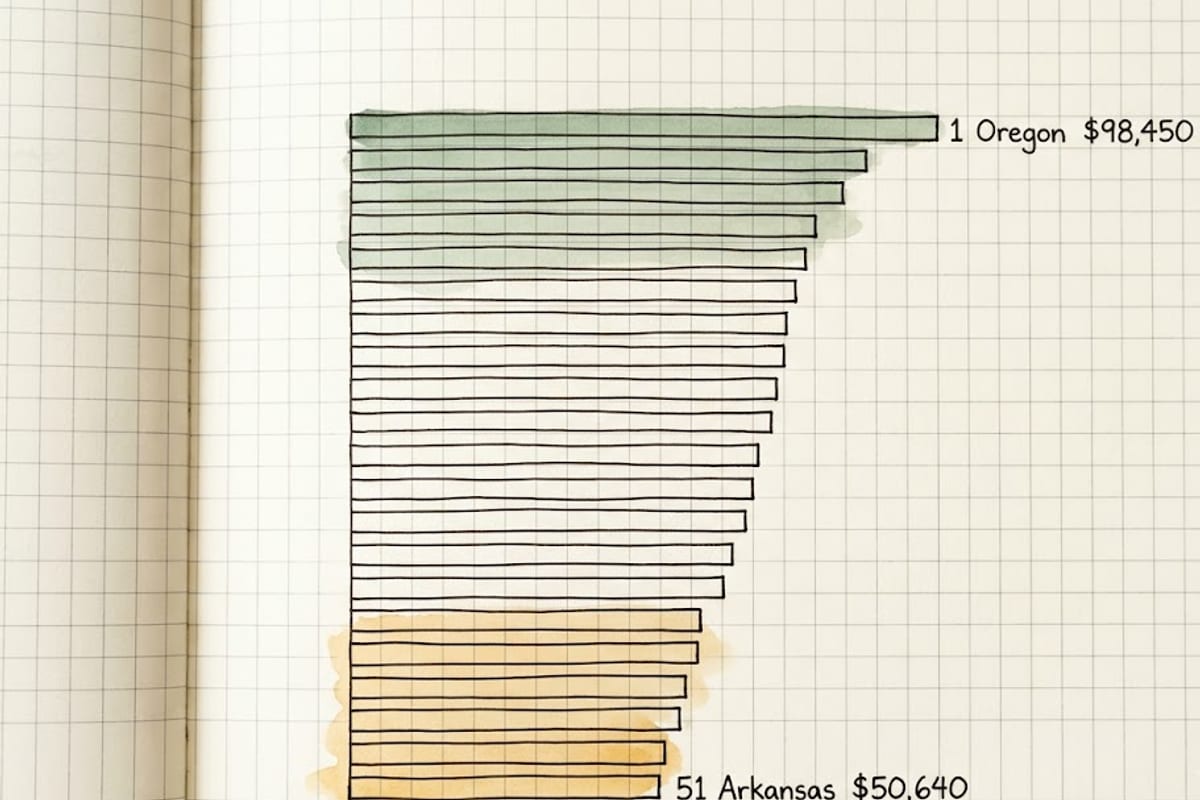
Oregon pays 94% more than Arkansas for the same licensed trade. That gap is larger than the step from apprentice to journeyman in most states.
The ranking is not a cost-of-living ranking
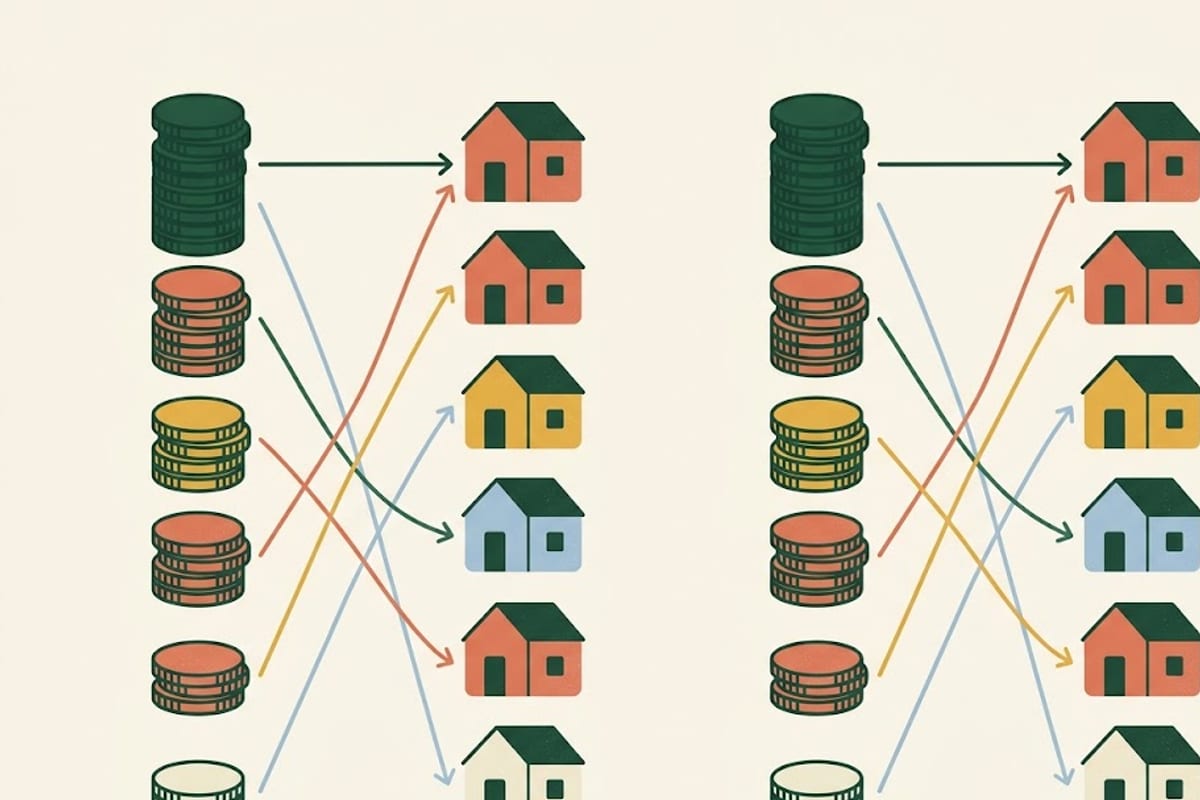
If pay tracked living costs, this list would open with Hawaii, California and New York. It opens with Oregon and Illinois, and Illinois outside Chicago is not an expensive state.
Meanwhile Florida sits 48th and Texas — with more construction volume than almost anywhere — sits in the bottom third.
Three things explain most of the order:
Union density and prevailing-wage law. The top of the list is largely United Association territory with legal wage floors on publicly funded work. Private employers compete against that floor, so it lifts the whole state.
Licensing strictness. Plumbing is licensed at state level almost everywhere, but the hour requirements and reciprocity rules differ sharply. Tighter requirements mean fewer licensed plumbers per capita and a higher price for them.
Right-to-work status. Most of the bottom quartile — Arkansas, South Carolina, Mississippi, North Carolina, Florida — are right-to-work states. This is the strongest single correlation visible in the table.
What the same licence does in two states
A journeyman moving from Arkansas to Oregon roughly doubles gross pay. Oregon rents are higher, but not doubled — Portland one-bedroom rents run well under twice Little Rock's, so the move is a real gain after housing rather than a wash.
That arithmetic is the practical value of this table, and it is worth doing properly: subtract tax, subtract housing, then compare. Oregon has no sales tax and a middling income tax; Arkansas has both.
Licence reciprocity is the friction. Agreements between states are specific and incomplete, and a licence that transfers on paper can still require an exam, documented hours, or a waiting period. Check the destination state's board before the move rather than after.
Reading a state figure honestly
It is a mean, not a median. Large industrial employers with high-paid pipefitters pull the mean above what a typical residential plumber earns. This matters most in states with refining, chemical or power generation industries.
It excludes the self-employed. In a trade where a large share of experienced people run their own operation, the published figure describes employees rather than the trade.
It blends three markets. Residential service, new construction and industrial pipefitting share this SOC code and pay very differently. The industrial end sits well above the state mean everywhere.
A state average hides its metros. New York State combines New York City with rural counties, and the spread inside a large state can be as wide as the spread between two states.
Where this trade sits overall
Plumbing has the highest national mean of the twelve construction trades tracked here at $72,170, just ahead of electricians at $71,490. Both are licensed; nothing else on the list is, in most states.
The state spread for plumbing is 1.94× — wide, but narrower than drywall installation at 2.46× or concrete finishing at 2.30×.
Individual state pages carry the full detail, and the trade ranking shows where plumbing sits against the rest. What the money buys locally is a separate calculation.
Source: U.S. Bureau of Labor Statistics, Occupational Employment and Wage Statistics, SOC 47-2152, annual mean wage. Self-employed excluded.