
Look at where electricians are paid most and the pattern is not what people expect:
| State | Electrician mean | Expensive state? |
|---|---|---|
| Oregon | $99,750 | Moderate |
| Washington | $94,470 | Moderate |
| Hawaii | $92,870 | Yes |
| Illinois | $92,230 | No, outside Chicago |
| Alaska | $90,040 | Yes |
| — | ||
| Colorado | $66,310 | Yes, and 33rd |
| Texas | $59,280 | No, and 46th |
| Arkansas | $53,470 | No, and 51st |
Illinois sits fourth and is not an expensive state. Colorado sits 33rd despite Denver housing costs well above the national median. Cost of living does not explain this table. Union density does.
Three mechanisms, in order of weight

1. Negotiated scale. IBEW local agreements set a journeyman rate for the jurisdiction. Every union contractor pays it, so there is no competing downward on labour price — competition happens on productivity and overhead instead.
2. Prevailing-wage law. Most of the top states require publicly funded construction to pay the locally prevailing rate, which in practice is close to union scale. Public work is a large share of the market, and a non-union contractor bidding it has to pay the same. That is the mechanism by which a union floor lifts non-union wages too — the effect is not confined to members.
3. Apprenticeship control. Joint labour-management apprenticeship programmes decide how many apprentices enter each year. That is a direct constraint on the supply of licensed journeymen, and a constrained supply raises the price.
The package is the larger half
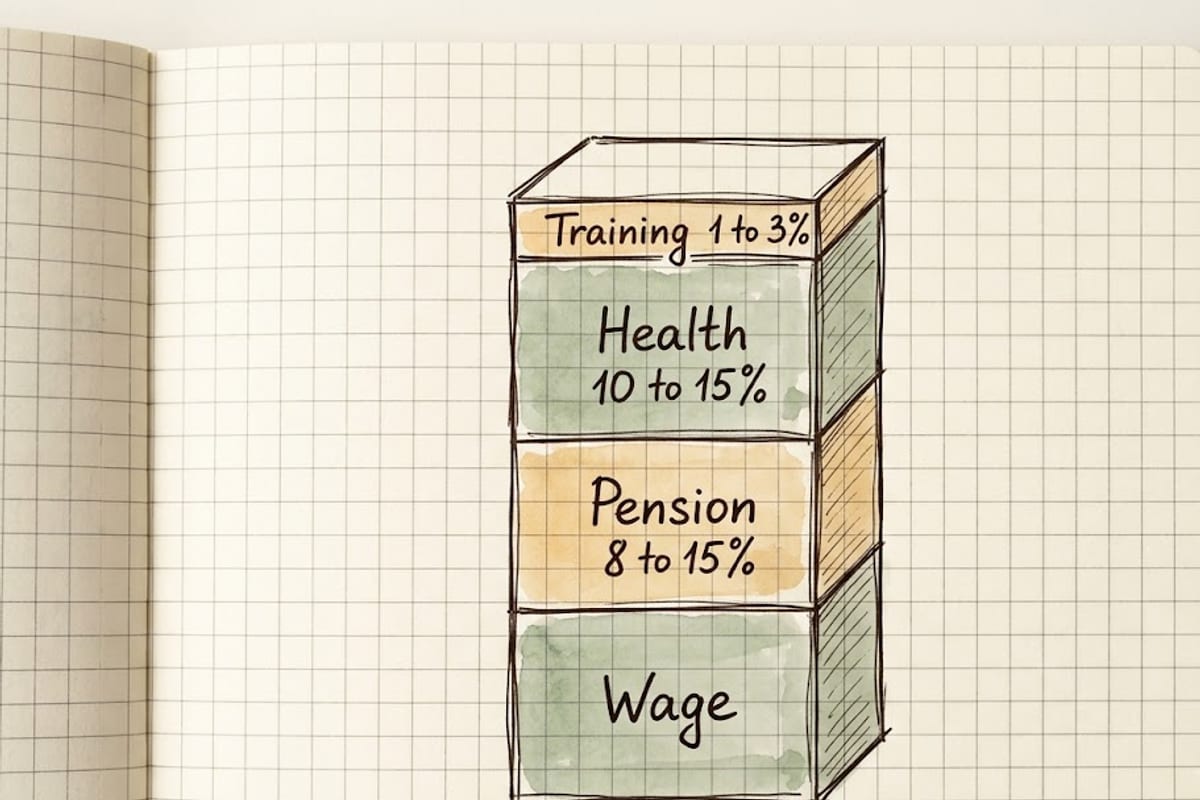
The hourly difference between union and non-union is often modest. The total compensation difference usually is not, because a union agreement adds employer contributions on top of the wage:
| Component | Typical addition |
|---|---|
| Pension / annuity | 8–15% of wage |
| Health and welfare | 10–15% |
| Training fund | 1–3% |
| Total package on top | 25–35% |
None of it appears in a BLS wage figure. Every number on this site is wages only, so a union job and a non-union job at the same published rate are not the same offer — and comparing them without the package attached compares two different things.
Defined-benefit pensions in particular have largely disappeared from non-union construction, and their replacement value is difficult to overstate for a thirty-year career.
What it costs in exchange
Dues, typically 2 to 4% of gross, plus initiation.
The hiring hall. In many locals, work is dispatched by the hall rather than found directly. That means steady placement across employers and less control over which job and which contractor.
Layoffs between projects. Union construction is project-based, and periods between dispatches are normal. Annual earnings depend on hours dispatched, which is one reason the BLS annual mean in strong union states sits below what scale × 2,080 would suggest.
Geography. Scale is local. A journeyman card transfers, but moving to another local means going onto their books, often behind their own members.
What this means for reading the state tables
A high state figure usually indicates a unionised, prevailing-wage market rather than an expensive one. That is good news for anyone moving there — the wage is high relative to local costs, not because of them.
Oregon and Washington pay electricians and plumbers more than California does, with substantially lower housing costs. That is the most useful single conclusion available from the wage tables on this site, and it is invisible if you assume pay tracks cost of living.
The full figures are on the electrician state page and the plumber one; the trade ranking shows which trades the licensing and union effects reach.