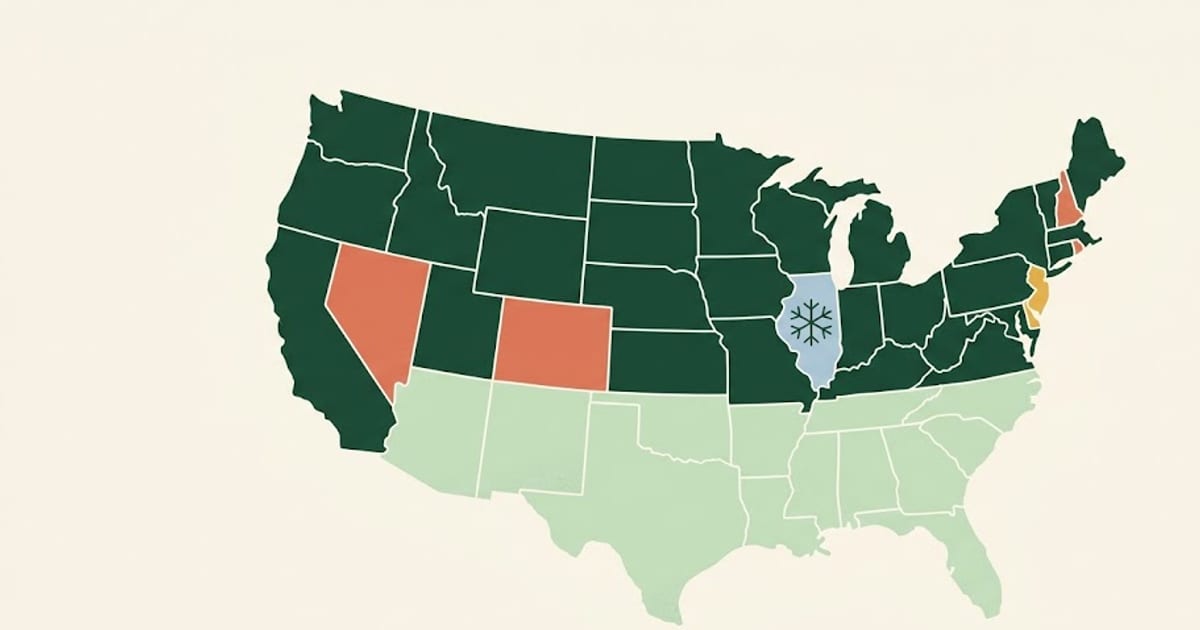
The BLS annual mean wage for roofers (SOC 47-2181) is $58,140 nationally. By state the range runs from around $45,000 to over $77,000.
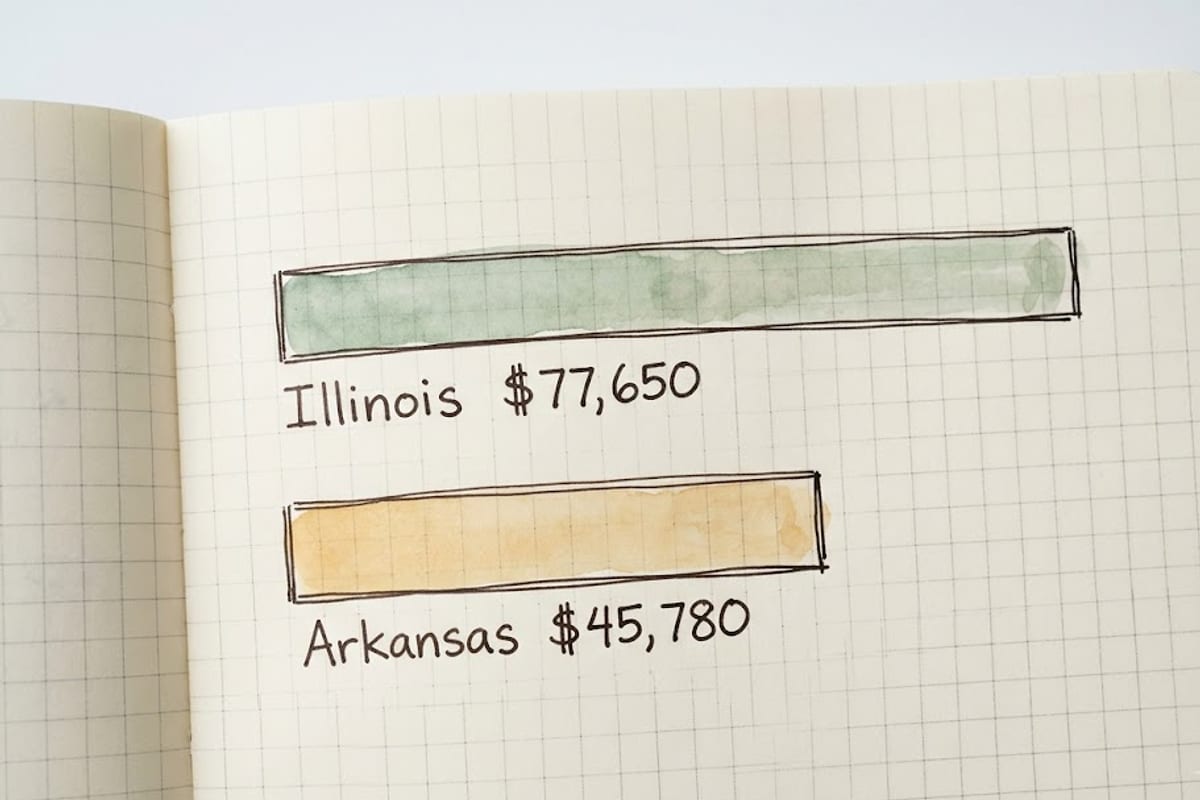
The extremes
| State | Annual mean |
|---|---|
| Illinois | $77,650 |
| District of Columbia | $68,740 |
| Connecticut | $68,490 |
| Alaska | $68,450 |
| California | $67,420 |
| National | $58,140 |
| Florida | $48,870 |
| Georgia | $48,440 |
| Alabama | $47,860 |
| Arkansas | $45,780 |
Cold states pay more, and it is not a coincidence
The pattern looks wrong at first. Florida and Georgia have enormous roofing demand and pay near the bottom; Illinois and Connecticut have short seasons and pay at the top.
Three things drive it.
Season length compresses the wage. A roofer in Illinois cannot work twelve months. To earn a living wage across a year, the hourly rate during the working season has to be higher — and the annual mean absorbs the idle months, so the underlying hourly rate is higher still than the table suggests.
Union presence. The same states that top the carpentry table top this one, and for the same reason.
Labour supply. Warm-climate roofing markets have deep, year-round labour pools with low barriers to entry. Competition among workers holds rates down. In a short-season market with fewer crews, contractors compete for the crews instead.
What this means for a roof price
Labour is roughly 60% of a residential roof replacement. A state where roofers average $77,650 against one where they average $45,780 carries a labour cost difference of about 70% — and that flows almost directly into the quote.
It is the largest single reason the same 2,000 square foot roof costs what it does in Chicago and what it does in Little Rock. Material prices vary regionally by far less.
Storm markets distort the picture
Hail and hurricane regions see crews travel in after a major event, and rates spike for a season. That surge does not persist in the annual data, which is one reason a state can feel expensive to hire in during a storm year while its published mean stays modest.
The corollary matters for anyone hiring: post-storm pricing reflects scarcity rather than the local wage base, and waiting a season where the roof allows often changes the quote substantially.
Reading the number
The BLS figure is an annual mean across everyone in the occupation in that state, including apprentices and including workers who did not have a full year of hours.
For an individual roofer, the state figure is a reasonable centre of gravity and a poor ceiling. Foremen, commercial crews and anyone doing metal or low-slope work sit well above it.
For someone pricing a roof, the state figure is the useful one — it explains the labour half of the quote, and it is public, checkable data rather than a contractor's assertion about what the market pays.
What the job actually pays for
Roofing has the highest fatality rate of any construction trade and one of the highest injury rates, and the wage reflects a labour market that has to attract people to that. Falls are the dominant cause, and steep-slope residential work is where they concentrate.
That risk profile is also why the trade has a high turnover rate, which loops back into pay: in markets where crews are hard to keep, contractors bid wages up. In markets with a steady inflow of new workers, they do not.
Residential against commercial
The SOC code covers both, and they are different jobs paid differently.
Steep-slope residential — asphalt shingle work, mostly small crews, often piece-rate rather than hourly. Piece rate rewards speed and punishes weather, and a fast crew in a busy season can earn well above the state mean while a slow month pays very little.
Low-slope commercial — TPO, EPDM, modified bitumen, built-up. Hourly, usually union in the states at the top of the table, and requiring torch, welder or adhesive certifications that residential work does not. This is where the highest individual earnings in the occupation sit.
A state whose roofing employment skews commercial reports a higher mean for that reason alone, independently of the local cost of living.
Using the figure
For hiring, the state figure is the honest basis for judging whether a labour line in a quote is plausible. For anyone in the trade, it is a floor to compare against rather than a target — foremen, commercial crews and certified installers all sit above it, and the gap between the mean and what an experienced installer commands is wider in this trade than in most.