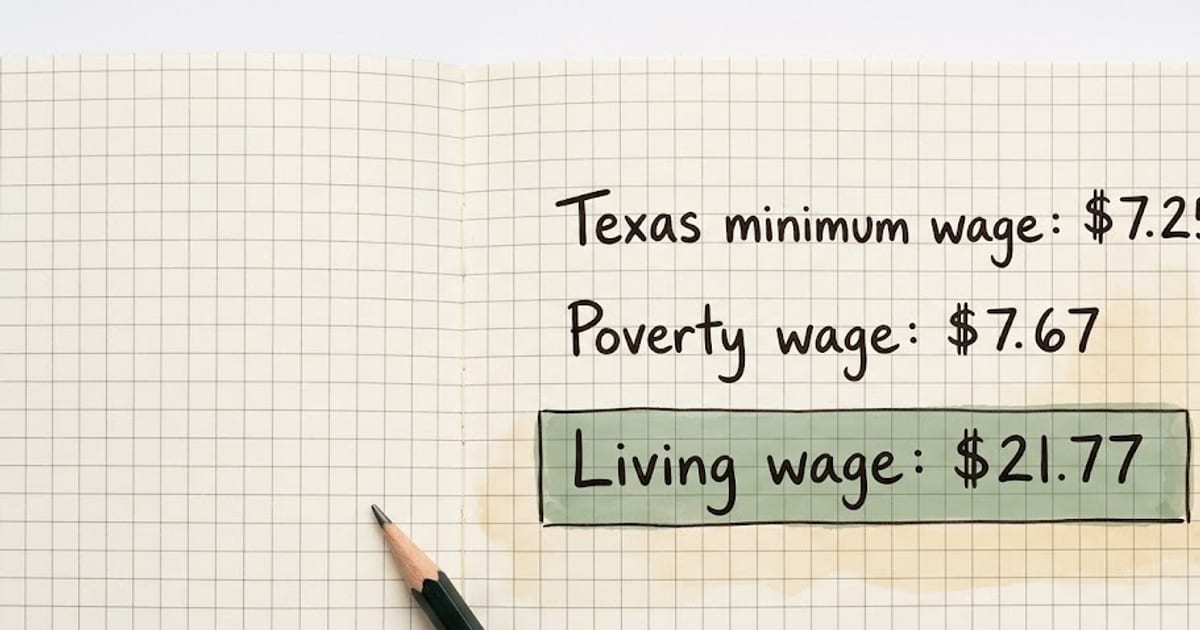
A livable wage is the hourly pay a full-time worker needs to cover basic living costs without public assistance. The most widely used figures come from the Living Wage Calculator at MIT, last updated in February 2026. For a single adult with no children, the living wage ranges from $20.69 an hour in Mississippi to $30.58 an hour in Massachusetts. In every state it is well above the minimum wage, and in states that still use the federal $7.25 minimum it is roughly three times higher.
The calculator assumes one worker employed full time, 2,080 hours a year, and a budget limited to necessities.
Living wage, minimum wage and poverty wage by state
| State | Living wage, 1 adult | Per year | 1 adult, 1 child | 2 working adults, 2 children (each) | Minimum wage |
|---|---|---|---|---|---|
| Massachusetts | $30.58 | $63,606 | $58.26 | $39.61 | $15.00 |
| California | $30.48 | $63,398 | $53.54 | $36.38 | $16.90 |
| New York | $29.89 | $62,171 | $51.24 | $35.04 | $17.00 |
| Washington | $26.59 | $55,307 | $48.00 | $33.87 | $17.13 |
| Florida | $24.09 | $50,107 | $39.87 | $26.85 | $14.00 |
| Texas | $21.77 | $45,282 | $35.77 | $24.45 | $7.25 |
| Ohio | $21.00 | $43,680 | $38.16 | $27.19 | $11.00 |
| Mississippi | $20.69 | $43,035 | $32.68 | $22.54 | $7.25 |
Source: MIT Living Wage Calculator, state-level figures, data updated February 15, 2026. Annual figures are the hourly rate times 2,080. Minimum wages are those listed by MIT; Florida's rises to $15.00 on September 30, 2026, and New York's is the rate for New York City, Long Island and Westchester.
The poverty wage in MIT's tables, $7.67 an hour for one adult, is the federal poverty guideline for a one-person household expressed as a full-time hourly rate. It is the same in every state in the contiguous U.S., which is why it says little about what life actually costs anywhere.
What the budget covers
MIT builds the living wage from separate estimates for each cost, using federal and industry data for the specific area. For a single adult in Texas, the annual budget is:
| Cost | Texas, per year | California, per year |
|---|---|---|
| Housing | $14,679 | $23,383 |
| Transportation | $9,013 | $9,528 |
| Food | $3,888 | $4,580 |
| Medical | $3,100 | $3,432 |
| Other necessities | $4,067 | $4,992 |
| Civic, internet and mobile | $4,095 | $5,501 |
| Needed after tax | $38,842 | $51,416 |
| Taxes | $6,449 | $11,986 |
| Needed before tax | $45,290 | $63,402 |
The California civic, internet and mobile line is the remainder of MIT's after-tax total once the other listed costs are subtracted.
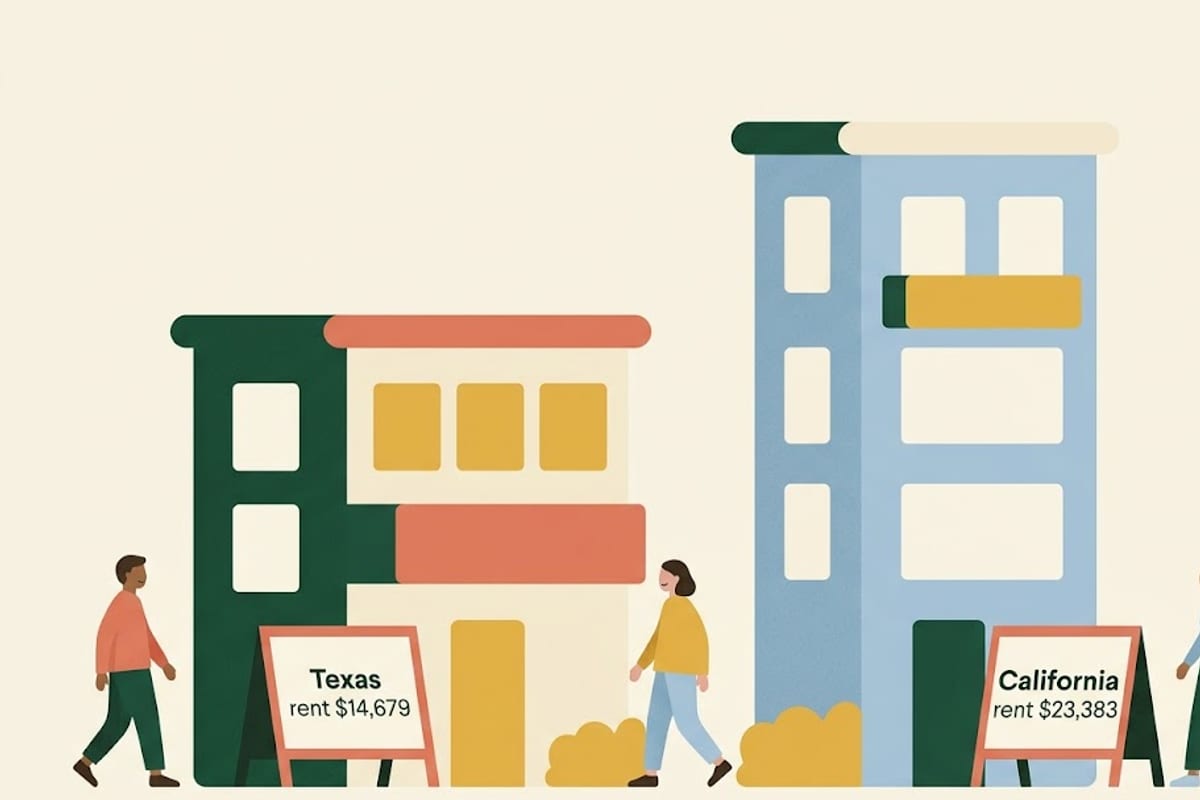
Housing explains most of the gap between states. A single adult in California needs $8,704 more a year for housing than one in Texas, which is 69% of the entire difference in after-tax budgets. Transportation, by contrast, costs almost the same in both.
What the budget leaves out
The living wage is a floor. MIT's methodology states that it does not budget for eating at restaurants or meals not prepared at home, for leisure time, holidays or unpaid vacation, or for savings, retirement and other long-term investments.
That means someone earning exactly the living wage can pay rent and bills but cannot save for an emergency, a car replacement or retirement. It also assumes full-time work all year. A worker who loses two weeks of pay, or works 32 hours instead of 40, falls below it even at the right hourly rate.
A budget that includes savings and some discretionary spending needs substantially more. That calculation, using the 50/30/20 rule and state-by-state take-home pay, is in how much you need to live comfortably.
Children change the number more than anything else
One child raises the living wage for a single parent by far more than any difference between states. In Texas it goes from $21.77 to $35.77 an hour, an increase of 64%. In Massachusetts it nearly doubles, from $30.58 to $58.26, mostly because of child care costs.

When two adults both work and share the costs of two children, the wage each of them needs is lower than a single parent's: $24.45 an hour each in Texas and $36.38 each in California. Two incomes cover the same housing and share the child care, which is why the per-person figure falls.
How the living wage compares with actual pay
The median full-time worker in the United States earned $1,251 a week in the second quarter of 2026, according to the Bureau of Labor Statistics. At 40 hours that is about $31.28 an hour, which is above the single-adult living wage in every state in the table. It is below the one-parent, one-child living wage in all of them.
Put another way, a single person earning a median wage can cover basic costs almost anywhere, while a single parent earning the same wage cannot cover them anywhere without help. For wage levels in between, the relevant question is which household the pay has to support.
What a living wage looks like as take-home pay
The living wage is a gross figure. After federal tax and payroll taxes, $45,000 a year in Texas leaves $38,338, which covers the Texas after-tax budget of $38,842 almost exactly. In California, $63,000 a year leaves $50,152 after federal and state tax, just short of the $51,416 budget. These come from the take-home pages for $45,000 in Texas and $63,000 in California, which use 2026 tax rates.
The hourly rate that gets you there depends on hours. $21.77 an hour at 40 hours is $45,282 a year, a little under $22 an hour at 40 hours a week, which is $45,760. At 32 hours a week, the same annual income needs $27.21 an hour.
County and metro figures
The state figures above are averages. MIT also publishes the living wage for every county and metro area, and within a state they can differ by more than the gap between states. In California, for example, the single-adult living wage in the San Jose metro area is $37.93 an hour according to MIT, well above the state figure of $30.48. Rural counties in the same state come in lower.
The cost that moves most between counties is again housing. MIT uses fair market rents published by the Department of Housing and Urban Development for each area, so a county with expensive rentals has a higher living wage even if its food and transport costs match the rest of the state. If you are comparing a job offer in a specific city, the county or metro figure is the one to use.
Living wage ordinances
Separately from MIT's estimates, some cities and counties have living wage ordinances. These usually apply only to the local government's own employees and its contractors, and set a higher minimum for them than the general minimum wage. They are legal requirements for those employers only and are generally lower than MIT's calculated living wage. If you work for a city contractor, your city's ordinance may set your floor.
Frequently asked questions
What is the difference between minimum wage and living wage? The minimum wage is the lowest pay allowed by law. The living wage is an estimate of what a full-time worker needs to cover basic costs. In most of the country the living wage is roughly double the minimum wage or more.
What is a livable wage for a single person? Between about $21 and $31 an hour in 2026, depending on the state, and more in the most expensive metro areas. MIT publishes county and metro figures as well as state averages.
Is $20 an hour a livable wage? For a single adult, $20 an hour is just below the living wage in every state in the table above. At 40 hours a week it is $41,600 a year.
Does the living wage include taxes? Yes. MIT adds estimated federal, state and payroll taxes to the budget, so the living wage is a pre-tax figure.
Sources
- MIT Living Wage Calculator, state pages and methodology, data updated February 15, 2026.
- U.S. Bureau of Labor Statistics, Usual Weekly Earnings of Wage and Salary Workers, second quarter 2026.
- Internal Revenue Service, Rev. Proc. 2025-32 (2026 brackets), for the take-home figures.